Class Intro
ISOM 475/575 · Data Visualization
Prasanna Parasurama
About me
- Assistant Professor, Information Systems and Operations Management
- Research focus: AI, labor markets, and online platforms
- Fourth year at Emory
- Before Emory: UMich (undergrad), San Francisco (industry), NYU (PhD)
About you
- Name
- Relevant background
- Education
- Industry experience
- Why are you taking this course?
About this course—what you will learn
- Fundamentals and principles of data visualization
- How to read, interpret, and evaluate data visualizations
- How to create good data visualizations
- For exploratory data analysis
- To effectively communicate data stories to others
Tech stack
Course site and Canvas
- Course site
- Lectures and course materials
- Canvas
- Quizzes
- Assignments
- Grades
- Announcements
Course components
| Component | Type | Weight |
|---|---|---|
| Attendance and participation | Individual | 5% |
| Canvas quizzes | Individual | 20% |
| Exercises and assignments | Individual | 15% |
| Midterm exam | Individual | 25% |
| Viz critique | Group | 10% |
| Final viz project | Group | 25% |
Attendance and participation
- Attendance is mandatory; there will be a sign-in sheet.
- You can miss up to one class without penalty.
- Participate in class discussions and exercises.
Quizzes
- In-class quiz after each module
- 10 questions
- 15 minutes
- Closed book
- LockDown Browser
Required readings
- Readings will be available on the course site or Canvas.
- Questions from the readings may appear on quizzes.
Exercises and assignments
- Individual work applying course concepts and tools
- Instructions and submissions on Canvas
- More information later
Midterm exam
- October 19
- Conceptual and application-based questions
- Multiple choice
- Closed book
- More information later
Viz critique
- Group project
- Evaluate an existing visualization
- Present a clear, evidence-based critique
- In-class presentations: November 2
- More information later
Final viz project
- Group project
- Apply the course’s analytical and design principles
- Final project presentations: December 7
- More information later
Policy on AI use
- AI is powerful, and its capabilities are improving rapidly.
- It can enhance learning or replace learning.
- My goal is to teach you how to use AI tools without replacing your learning.
- Assignments and projects: AI use is allowed.
- Quizzes and exams: AI use is prohibited.
- These are closed-book assessments.
- They account for 45% of your grade.
A cautionary tale on AI and learning
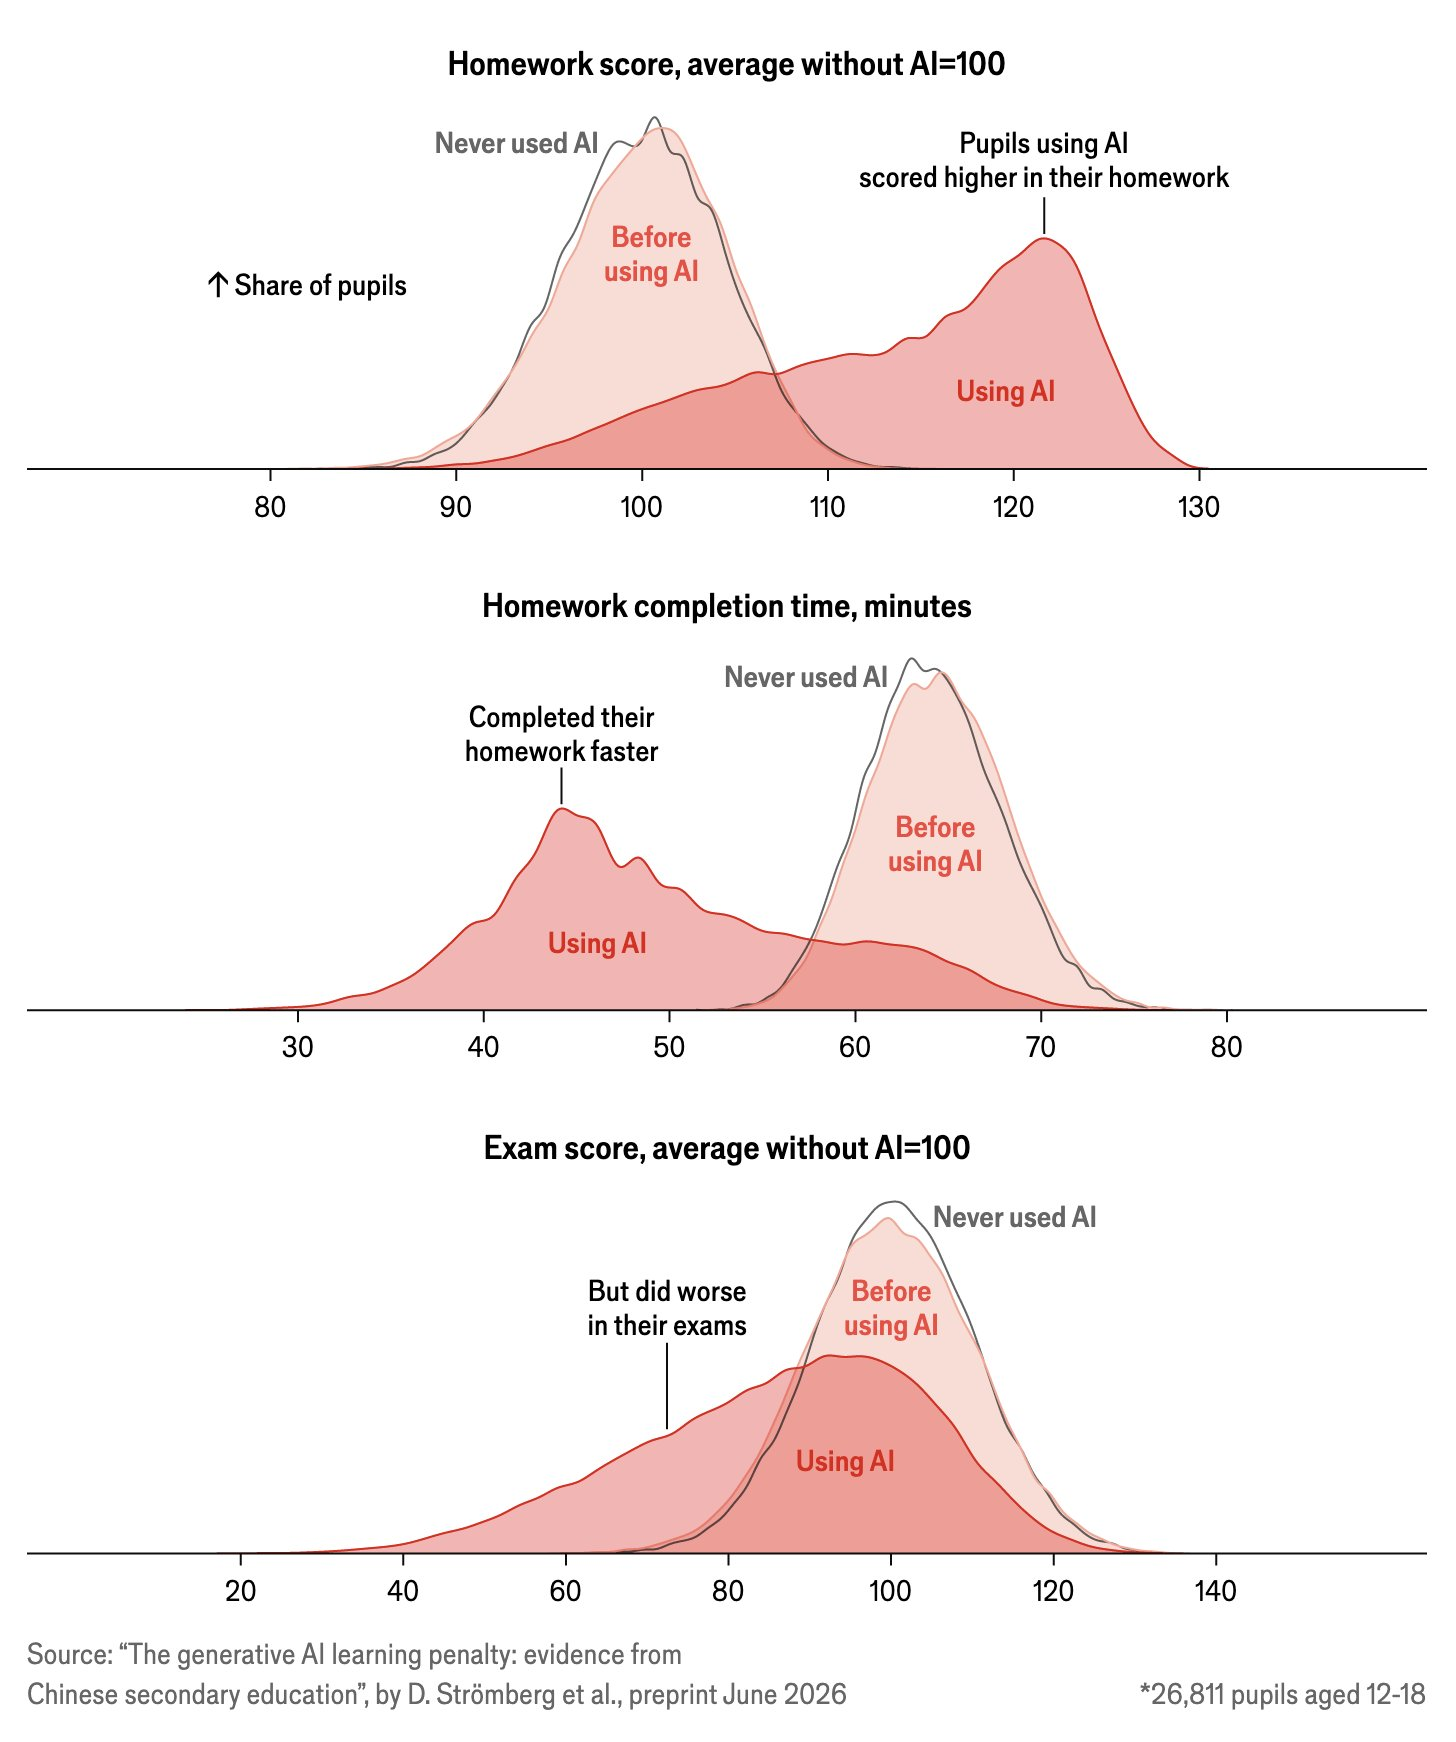
Source: Strömberg, Lei, and Wu (2026); visualization from The Economist, August 18, 2026.